Traditional eductaion used the straight line graphs to get students to understand the dynamics and characteristics of the Break Even Point.
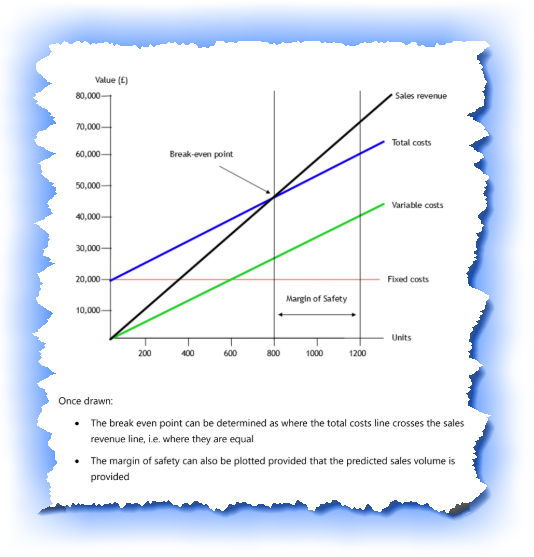
This method was useful for textbooks and many students still today refer to these plotted points on a static graph to determine not only where the BEP resides on the sales curve, but also to determine the “MARGIN OF SAFETY” for the budgeted turnover figures.
However, on many occassions a business entity found itself in a cash flow crunch shortly into the new financial period.
Many could not SEE why this would be the case.
D-LENS has changed all of that.
Not only does it highlight what could be causing the Divergence from the budget numbers but it is a powerful tool for students to really come to terms with both the characteristics of the operations of the BEP calculations as well as where potential risks may exist within the accounting paradigms of the calculations.
Logic Model 9 — Boardroom Decision Engine
Build your real cost structure and product mix. Then watch what three different breakeven points do when you change a single decision — or apply a market shock in one click.
| Cost element | Amount (R) | Adjust | % of total | Active |
|---|---|---|---|---|
| Total fixed costs | R0 | |||
| Product / segment | Revenue (R) | C/S % | C/S ratio slider | Contribution | On |
|---|---|---|---|---|---|
| Totals / weighted avg | R0 | —% | R0 |