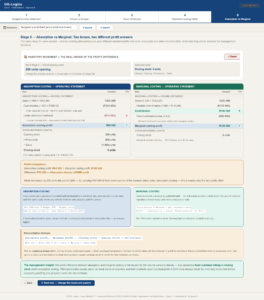
The often challenging world of mastering variance analysis is now easy to conquer …
Whether you are a business leader wanting to get to the bottom of what is going wrong with your usage of a raw materials,
or you a student trying to understand how to calculate an answer in an assignment…
this model will help you to understand it.
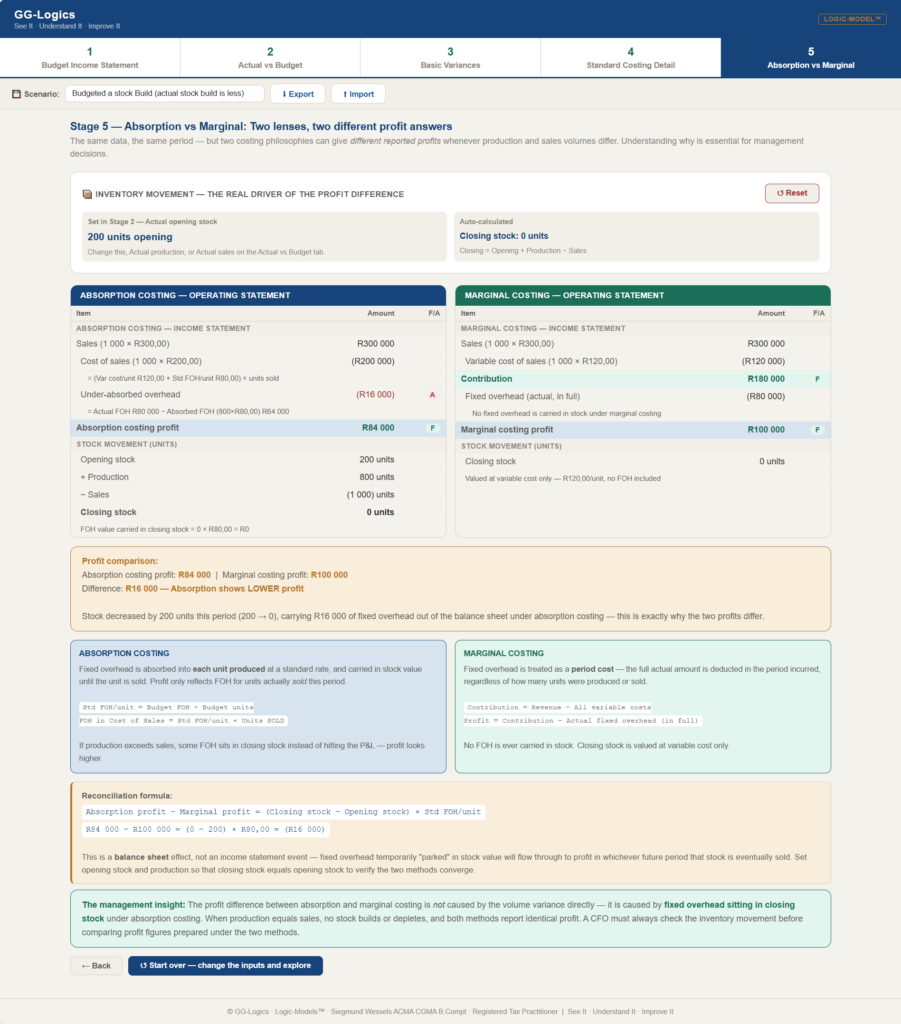

And here is the beauty of this solution.
You do not need to do hundreds of calculations!
This model will help you see why a certain business decision is not good for your business.
It will help you understand what is really causing the variances in your profits.
Gone are the days of being a highly technical accountant to do the calculations.
If you a student you can pull one lever at a time and see how the profits are being affected by a change in one variable.
You will be able to distinguish which areas of the business you need to concentrate on to improve your profit the most.
Let me explain a little about the tool.
Many students are taught the benefits of a management accounting technique called variance analysis.
This is an extremely useful tool when looking at a company’s results.
Financial reports are often compared between one period and the next to get insights into how a business is performing.
Sometimes businesses compare their actual results to those that they expected when they compiled a budget.
However, if you only use the financial income statement reports to do such a comparison it may give you variances that make no sense.
Other times you do cannot get a real feel of what is driving the changes you see…
Is it due to inefficient production outputs, a volume increase in the sales (they did increase of course) or was the material so bad that there were a lot of reworks ( look at the material variance)?
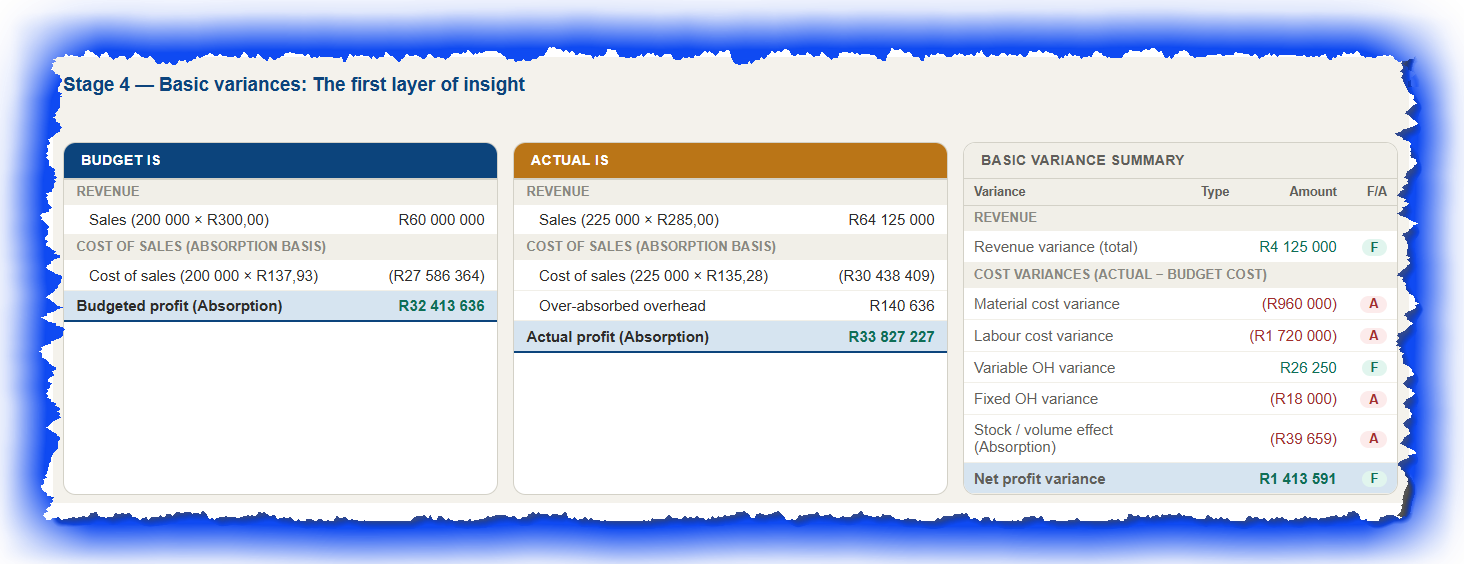
A proper Standard Variance Analysis system, will show you what part of the changes belong to the raw material prices, or that the selling prices were different, as well as what part of the variance belongs to volume changes due to market demands or production ineffeciencies.
Business leaders found these exercises cumbersome in the past and it required a knowledge base that many did not have readily available in their arsenal of skills.
This dynamic tool makes that thinking obsolete.
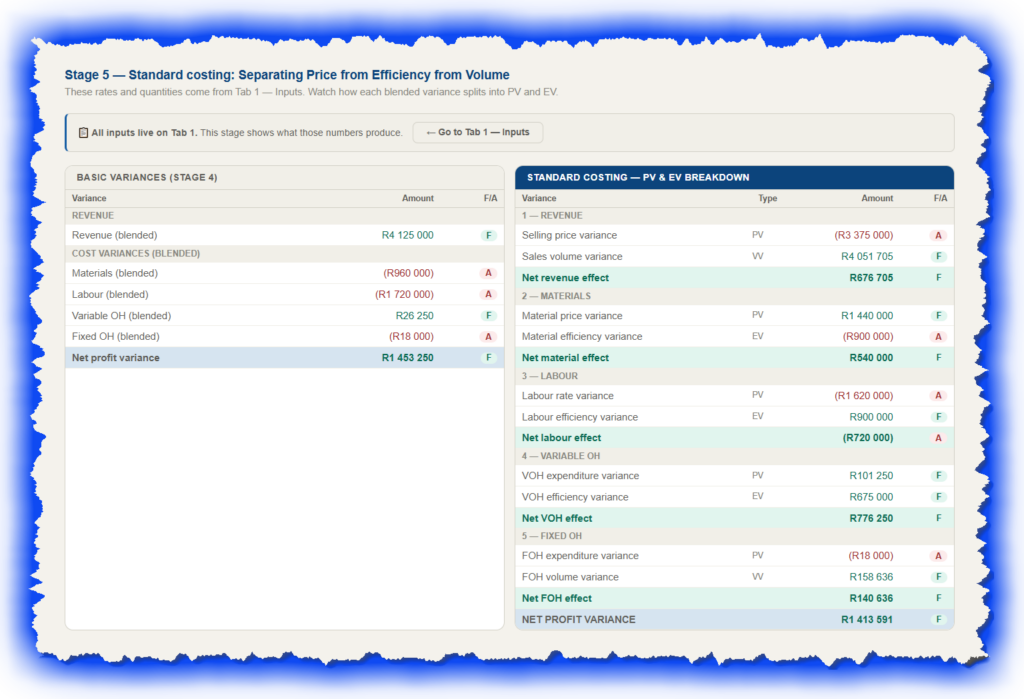
Before you go there you may want to read up a little about the tool.
See below how the tool actually works.
You can access it and then play with the numbers.
See how business decisions make a difference in a business entities results …