And then the circumstances change — while the calculation is assumed to still hold.
In forty years of working with businesses from startup floors to listed boardrooms, I have watched this single habit do more silent damage than almost any other. Not because anyone is careless. Because the break-even point they checked was answering a different question than the one that matters.
Let me show you what I mean with a scenario I have seen too many times to count.
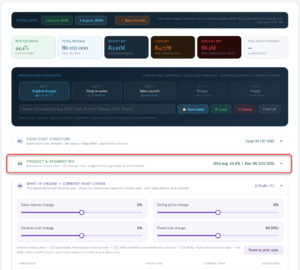
That you can try out to feel and see its power.

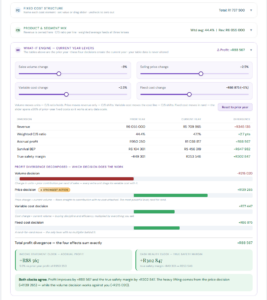
You built the budget properly. Sales forecasts grounded in real market intelligence. Product costs analysed line by line — the variance analysis shows only small movements from prices and efficiencies. Fixed costs reviewed category by category, with the flexibility in each one understood.
The ratios back you up: ROE at 10%, EBITDA margin at 23%, gross margin at 49%. Nothing exotic — a solid, controlled business.
Cash flow projections have been compiled by week. A few pressure points, all navigable.
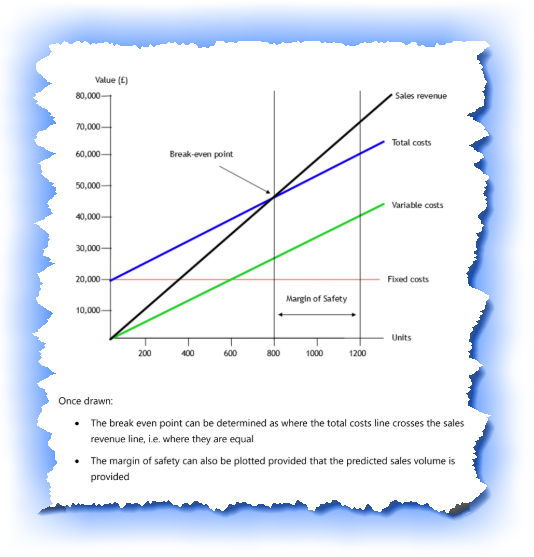
You even checked the safety margin on the break-even point: revenue sits more than 33% above it. Healthy. And the new product launch should widen that cushion further.
Every box ticked. Every light green.
So why, two months into the new year, does cash feel tighter than the plan said it would?
You investigate. Debtors’ days have drifted from 37 to 41 — but that’s the usual slow start to the year; it should correct. The market is calm. Sales targets are being met.
Everything that is supposed to explain a cash squeeze… doesn’t.
Where is the gap?
Here is the uncomfortable answer: there is more than one break-even point — and most finance professionals were never taught to look for the others.
The break-even point on the budget assumes every rand invoiced becomes a rand of cash. It doesn’t. At a 41-day collection cycle with a portion of debtors slipping further, your effective contribution per rand of sales is lower than the budget believes — which means the real break-even sits higher than the one on the chart.
Then there is the expenditure that never touches the income statement at all. The maintenance that gets capitalised — spent every year, as reliably as rent, yet invisible to the break-even calculation because it lives on the balance sheet. If you are not looking for it, it disappears silently. It is one of the most common undetected cash consumers I encounter.
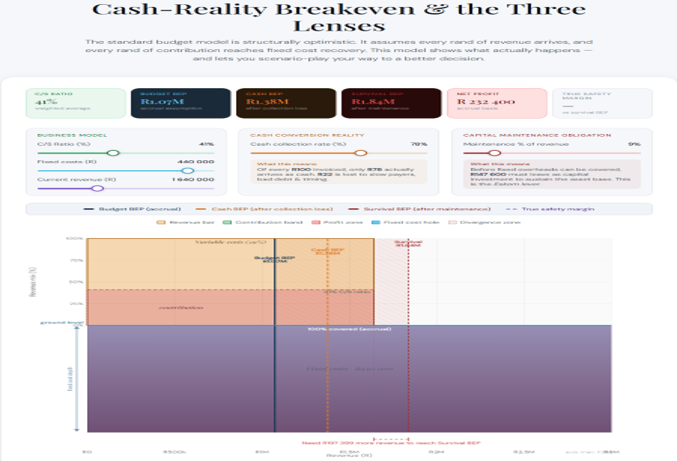
And the third culprit is the strangest of all, because it doesn’t just hide from the income statement — it shows up there disguised as profit.
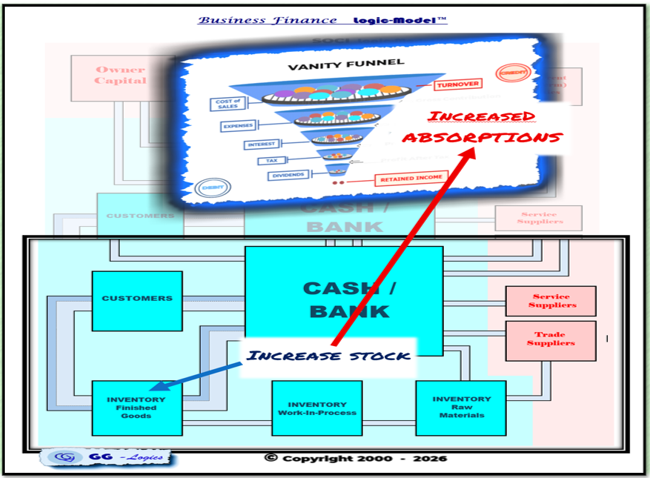
When production runs ahead of sales, the cash cost of the unsold units leaves the bank and settles on the warehouse shelf. Meanwhile, under absorption costing, the fixed overhead carried into that closing stock lifts reported profit. Absorption recoveries silently appear as profit in the income statement — while being silent consumers of cash.
Read that again. The same event that drains the bank account improves the profit line.
tied up in the Working Capital
disguised as
in the Income Statement.
The budget break-even sees none of this. Which is why the business in our scenario can pass every test on paper and still feel the squeeze in the second month.
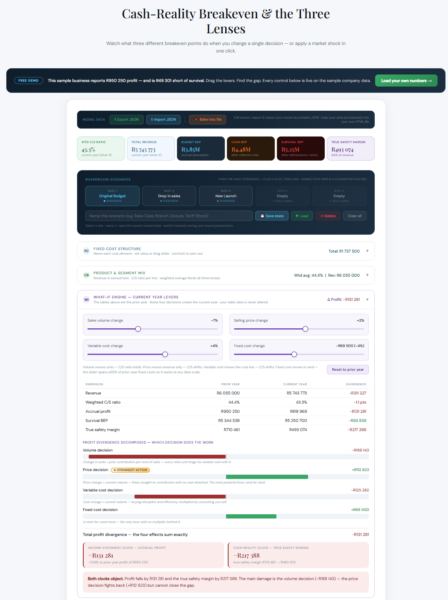
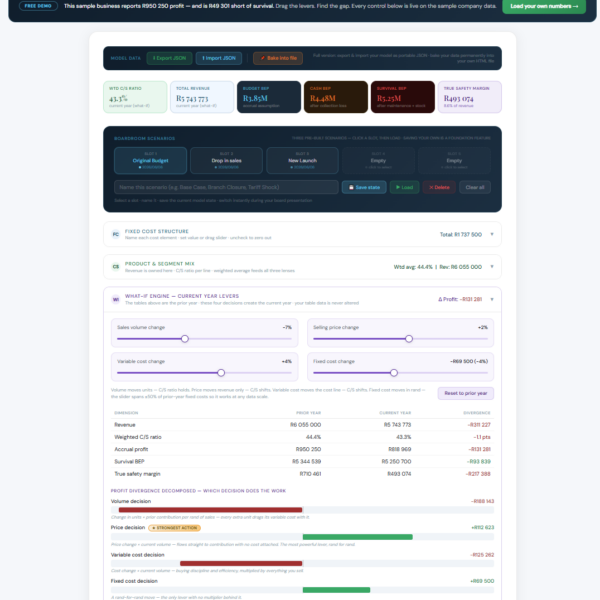
Bigger than most boards would believe. In the sample company I use to teach this, the income statement reports R950 250 of profit — a business comfortably past its budgeted break-even, safety margin intact.
Run the same business through the cash-reality lenses — collections at 82%, the annual capitalised maintenance, the stock movement — and it is R49 301 short of the revenue it needs to survive the year.
Profitable, and short of survival, simultaneously. Nobody falsified anything. Every number is honest. The three statements are simply telling different stories — and the divergence between them is the finding.