


From the concertina below select your topic and see what tools exist on the tabs.
Choose from our price list the plan that suits your needs.
Ideal options for
Here are some examples of some of the more than 50 interactive models that help one to master financial concepts with.
SEE IT
UNDERSTAND IT
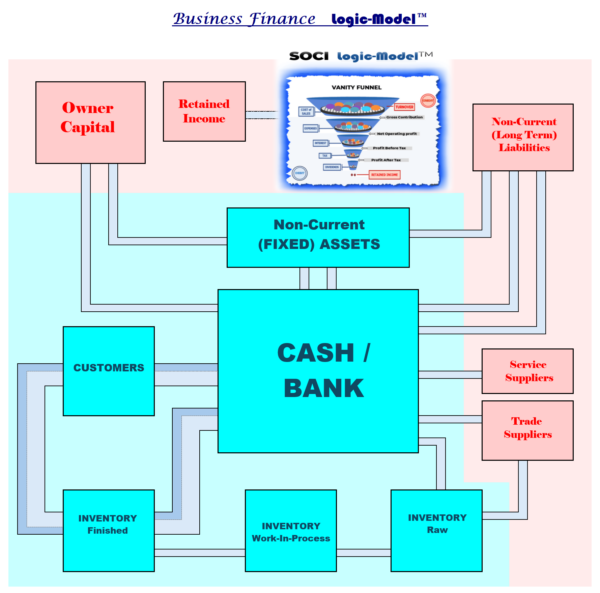
Understand how finances flow within the business.
See which cash flows are operational and which ones are tactical. What business decisions affect which areas.
Visually understand what areas the financial reports concentrate on.
A basic Tool that shows the workings
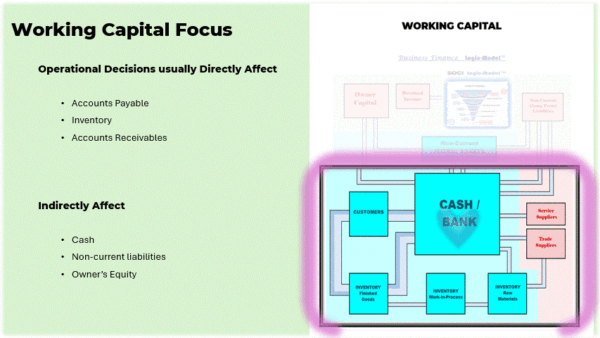
This tool illustrates the laws that govern the First Rule for Financial Survival.
It dynamically shows those important elements that are often ignored in the cash flow reports, that can lead to success or failure for a business netity.
The focus area of exactly how the cash flow for fixed assets affects the working capital.
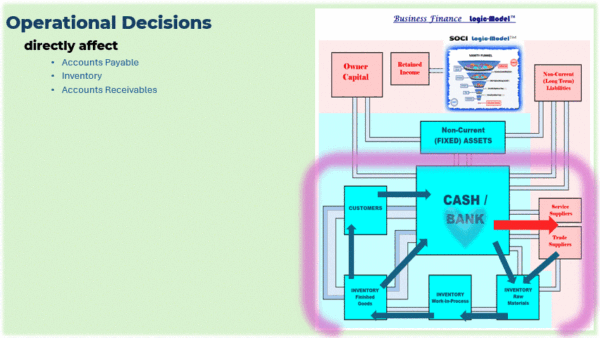
The significance of this area of a business is often glanced over glibly and ignored in the future, much to the detriment of cash management.
The model is simple to understand but many do not appreciate its significance in business especially around the FI-SO principle
usually based on a single product and a simple pricing structure it shows the following :
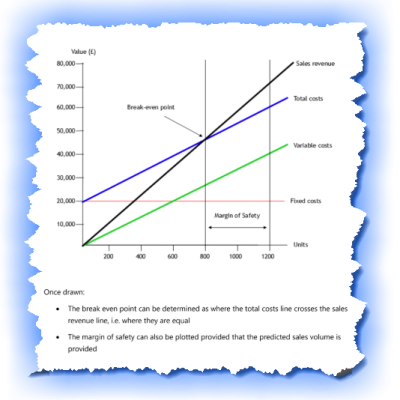
This is a great tool to illustrate where a break even point may exist in a simple enviornment where a company sells a single product type at a constant price.
Traditional methods teach the break even point as an academic graphic.
It shows a straight line graph for the fixed costs as though they happen consistenetly in a perfect world.
It also introduces the variable costs as a straight line based on the input variable costs.
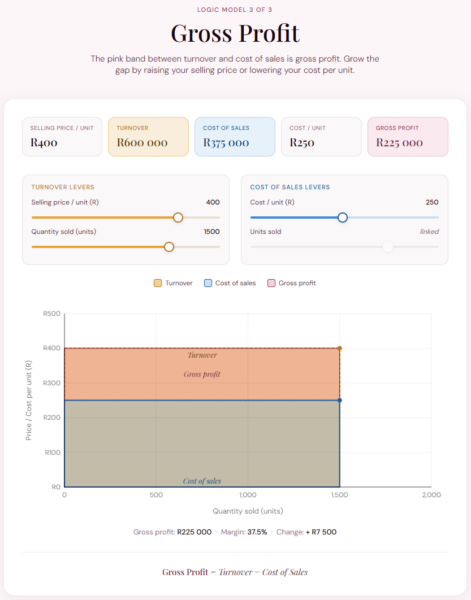
This tool illustrates how Turnover consists of two elements and the relationship these elements have with one another.
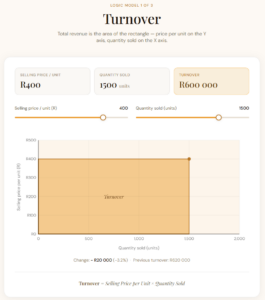
Ideal for understanding the basic drivers of Turnover.
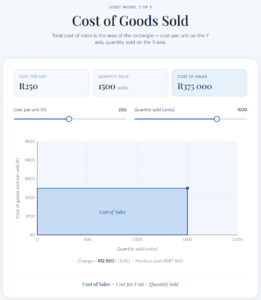
This tool illustrates the relationship between the quantity of sales and the Costs of those goods sold.
This tool is essential to understanding how basic costings fit into standard variance analysis
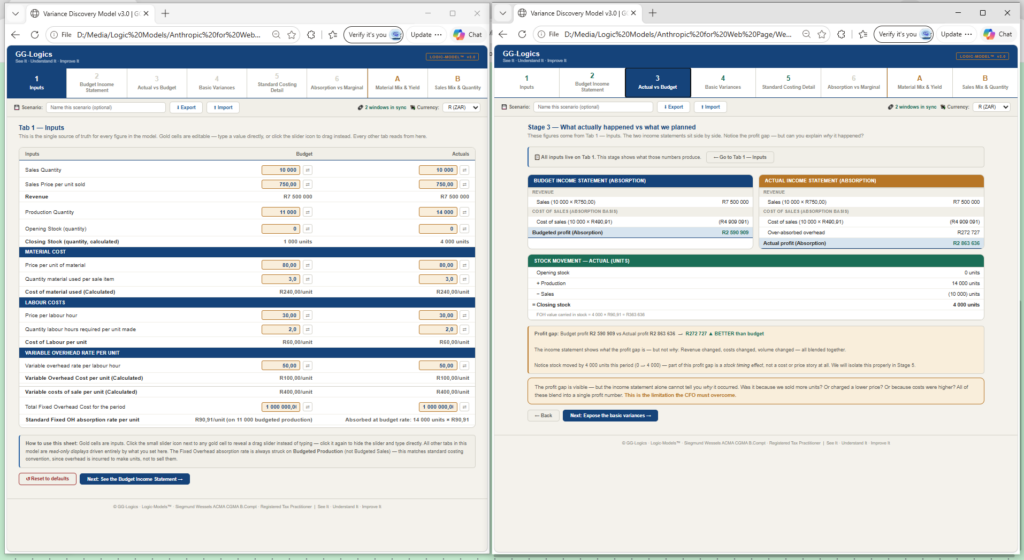
Students of managment accounting often get confused between Variable Costs and Fixed Costs and their characteristics
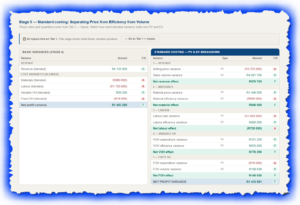
It is important to learn what a standard Income Statement will show and what elements of efficiencies a marginal and/or a standard costing analysis will highlight.
This tool shows how these areas have differing characteristics.